All your Google Analytics properties on one screen
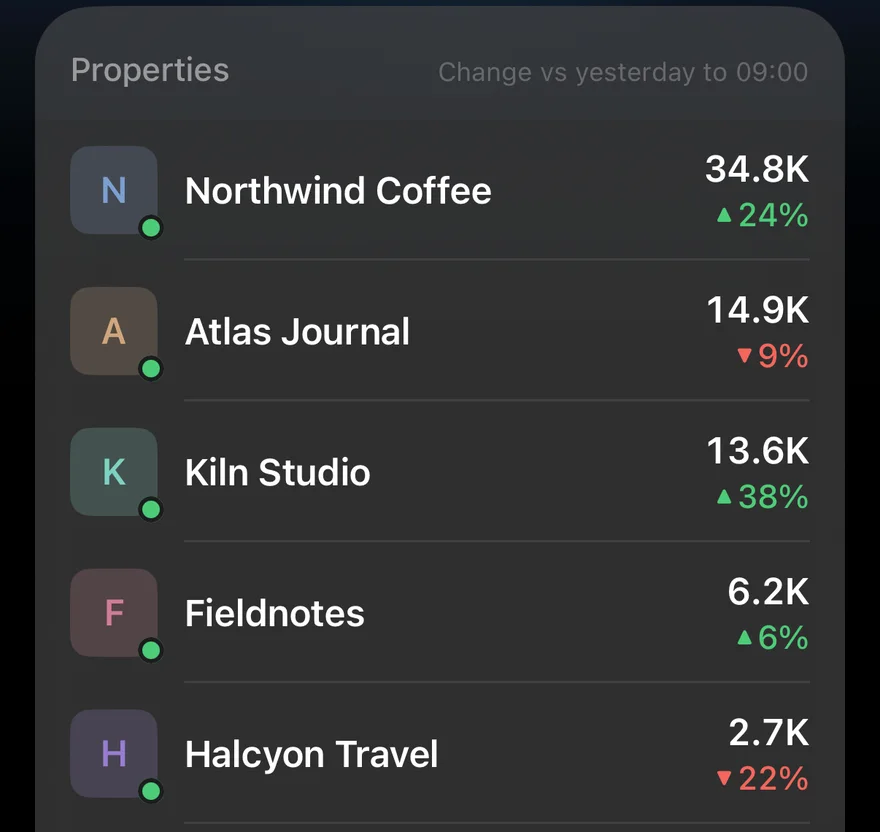
If you run more than one website, Google Analytics makes you check them one at a time: pick an account, pick a property, wait for the report, go back, repeat. GA Bridge starts from the opposite end. Sign in once with the Google account you use for Analytics and every GA4 property you can see, across every account, appears on one screen.
What the dashboard shows
Each site gets one row: its icon, its name, the number of users for the time frame you've chosen, and how that compares with the period before. Busy sites rise to the top; sites with nobody on them drop into a quieter group underneath, so the list is mostly what's moving. Since iPhone 1.2 (36) and Android 1.2 (33), a site that's well ahead of or behind its typical day says so under its name: spot an unusual day at a glance.
Above the list is the total across everything you run, with its own trend, and a pill showing how many people are on your sites right now. Tap it to switch the list to live visitors, refreshed every minute.
Time frames
The big title is the time frame picker: Today, Yesterday, 7 days or 28 days. Every number on the screen follows it, and the choice is remembered next time you open the app.
Only the sites you care about
Swipe a row to hide it, or open Properties in the settings menu to choose which sites appear. Hidden properties aren't loaded at all, which keeps the dashboard fast if your account can see dozens of properties you don't look after.
Read-only, on your device
GA Bridge asks Google for one permission, read-only access to Analytics. Reports go straight from your phone (or browser) to Google; there's no GA Bridge server in between, and nothing is stored anywhere but your device.
For the other ways to do this, including roll-up properties and Looker Studio, see how to see all your Google Analytics properties at once.