A fair comparison with yesterday
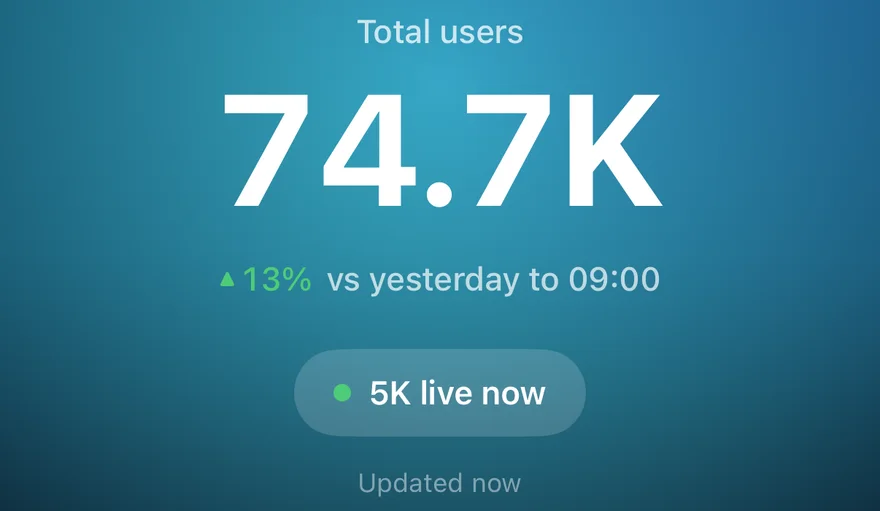
At 10am, today has had ten hours. Yesterday had twenty-four. Put the two totals side by side and every site looks like it's having a terrible day, every morning.
GA Bridge doesn't do that. On Today, the trend next to each figure compares the hours that have finished so far with the same hours yesterday. At 10:15 you're comparing 00:00–10:00 today with 00:00–10:00 yesterday, and the caption says so: "vs yesterday to 10:00".
Users counted properly
The comparison filters by hour rather than adding up hourly figures. Someone who visits at 9am and again at 11am is still one user, as they are in Google Analytics itself, so the numbers match what you'd see in GA.
Other time frames
- Yesterday compares with the day before.
- 7 days compares with the previous 7 days.
- 28 days compares with the previous 28 days.
Each site's row, and the total for all of them, show the change as a percentage in green or red, so a quick look down the list shows which sites are up and which are down.
Small numbers get a difference, not a percentage
Eight users against thirteen is "down 38%", in red, and it's five people. Since iPhone 1.1.2 (35), when both sides of a comparison are under 30 users, a site's screen says what happened in plain words and plain ink: "5 fewer than yesterday by 14:00". The views, sessions, engagement rate and engagement time underneath show their change the same way ("▼ 7", "▲ 8 pts", "▼ 26s"), the chart's caption reads "A typical day has 13 by 14:00", and the screen keeps its usual indigo instead of leaning red or green over a handful of visits.
With 30 or more users on either side, it's the percentage as before.
If a site still looks down after a fair comparison, why your Google Analytics traffic looks down today goes through the other usual causes.