Is today busier than usual? The typical-day chart
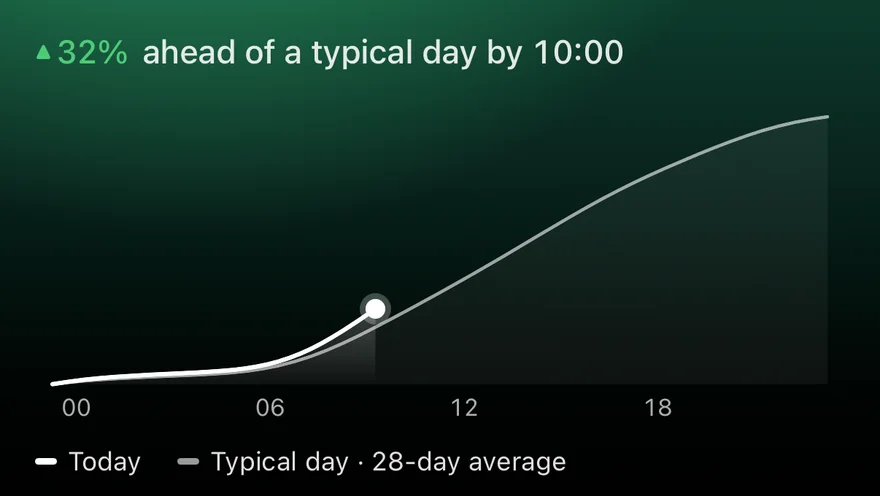
A single number can't tell you whether 340 users by lunchtime is good. It depends on the site, the day and the hour. So each site's page in GA Bridge has a chart that answers it directly.
Two lines
- Today builds up hour by hour: users so far, as the day goes on.
- Typical day is the same build-up for an average day, worked out from the last 28 complete days.
Where the bright line sits above the faint one, you're ahead of normal for that hour; below it, you're behind. The line above the chart puts it in words, such as "+18% ahead of a typical day by 14:00".
Why running totals
Small sites have spiky hours: three visitors at 9am, none at 10am, five at 11am. Plotted raw, that's noise. As running totals the lines climb smoothly, and the gap between them is easy to read at any point in the day.
Drag to read any hour
Touch and drag across the chart to see both lines' values at that hour. On Yesterday the chart shows the whole day; on 7 days and 28 days it switches to one column per day.
On the list of sites
Since iPhone 1.2 (36) and Android 1.2 (33), the dashboard uses the same typical day: a site well ahead of it or well behind it to the same hour says so in its row ("2.4× typical"), so you can spot an unusual day at a glance without opening each site.