Engagement rate and average engagement time, on every site's page
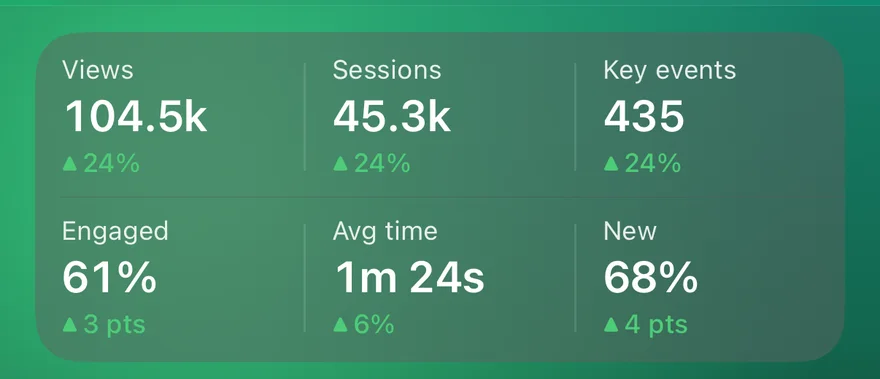
A user count says how many people came. It doesn't say whether they stayed. Each site's page now has four more numbers under the headline, in a row of small tiles:
- Views: page views for the time frame.
- Sessions: visits. One person coming back in the afternoon is a second session.
- Engagement rate: the share of sessions that Google Analytics counts as engaged, which means they lasted 10 seconds or more, viewed two or more pages, or fired a key event. A site at 61% has three in five visitors doing more than bouncing.
- Average engagement time: how long an engaged visitor actually had your site in front of them, per session. This is Google Analytics 4's "average engagement time per session", counted only while the page was in the foreground, so an open tab left behind on another desktop doesn't inflate it.
Compared fairly
Every tile carries its change against the same comparison as the headline: on Today, the completed hours so far against the same hours yesterday (why that matters); on Yesterday, 7 days and 28 days, the equal period before. A rate's change is relative: engagement going from 58% to 61% shows as up 5%.
Where to find it
Tap any site on the dashboard, or, if you track one site, it's right on the dashboard. On iPhone (since 1.1.2) and Android (since 1.2), they sit in one strip under the chart and the live-now card; on the web they sit between the live-now pill and the chart. With likely bots hidden, bot sessions are left out of these too, which is where you'll see the biggest difference: data-centre traffic has an engagement rate near zero and drags the average down.
Since 1.2: new visitors and key events
Since iPhone 1.2 (36) and Android 1.2 (33), the strip has two rows and two more tiles. Key events counts the events you've marked as outcomes in Google Analytics, such as sign-ups and purchases. New is the share of users who'd never visited before: a jump means strangers arriving, often from a link somewhere, rather than regulars coming back. To see which link, the What changed card on the same page names the sources that grew.
For what Google Analytics counts as an engaged session, and what a good rate looks like, see GA4 engagement rate explained.